Journey Times
See whether a scheme worked, where congestion is building and how a corridor has changed over time.

If you can ask the question, you should be able to get the answer.

Sign up to our webinar, with Cambridgeshire County Council and Cambridge and the Greater Cambridge Partnership to see how Alchera is supporting decision making for Local Authorities.
See whether a scheme worked, where congestion is building and how a corridor has changed over time.
If you can ask the question, you should be able to get the answer.

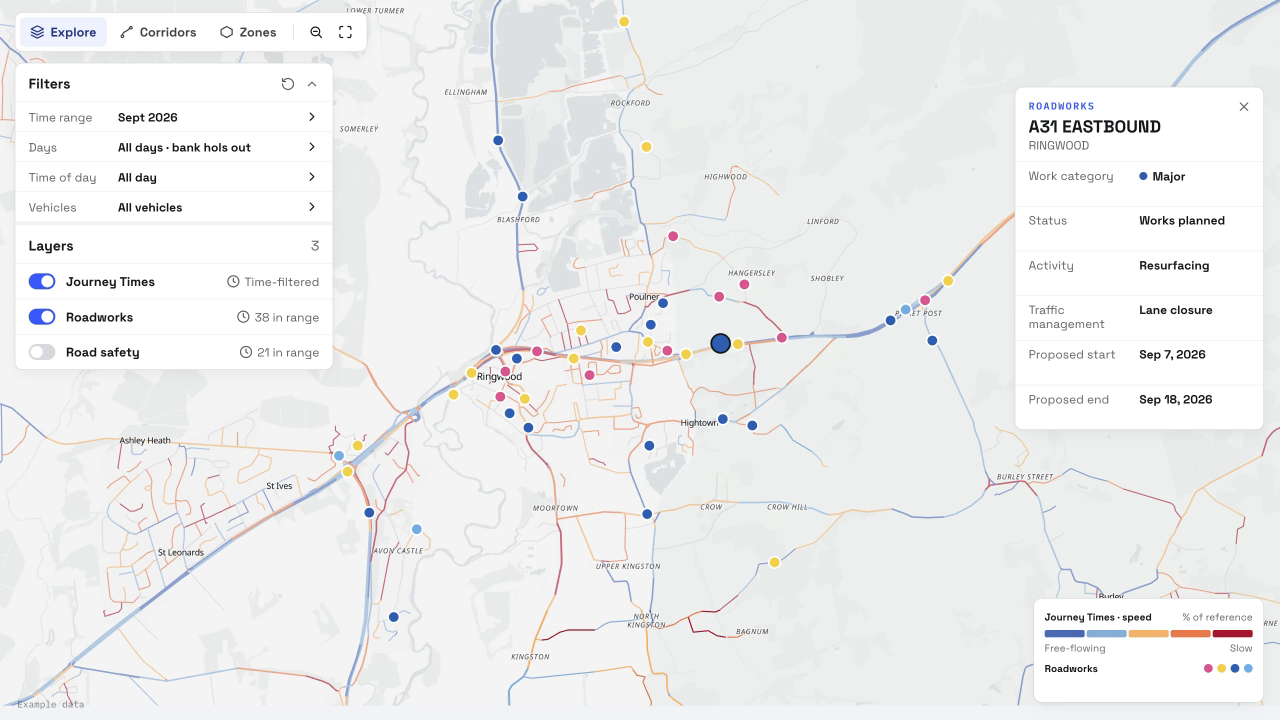
Journey Times puts your data on an interactive map, so anyone on the team can explore it.

See speed and delay across the whole network at a glance, filtered by date, time of day, vehicle type and more. Drill into any corridor or scheme, and compare before and after an intervention.

Overlay roadworks, road safety and event data to see why journey times changed, not just that they did. Uncover the real cause behind every delay, and avoid reporting changes incorrectly.

Get from question to evidence in minutes, without waiting on an analyst or a data request. Build a clear picture of what’s really affecting journey times, and make decisions with confidence.
Planners, engineers and scheme sponsors can answer their own questions as they come up, without waiting for an analyst.
That gives analysts time back for modelling, appraisal and the problems that need their expertise.